Elevation Data
Why no two elevation profiles agree
The race website says 5,200 m of climbing. Your watch said 4,900 last year, a friend's said 5,600, and ultraPacer says 5,350. Nobody is wrong, exactly. Elevation is measured in one of two very different ways and then it is counted, and both steps involve choices that can move the total by 10% or more.
Here is where elevation data comes from, how ultraPacer turns it into the grades it paces from, and what to check when a profile looks wrong.
Two ways to measure a mountain
A digital elevation model (DEM) is a grid of ground heights, surveyed from above by aircraft lidar or satellite radar. To give a route a profile you look up each of its points in the grid. Route planners like CalTopo and Strava do this, as does "elevation correction" on activity sites, and ultraPacer when a course arrives without elevation. A DEM is absolute and consistent: the same line gets the same answer whatever the weather or device. Its weaknesses come from the grid:
- Resolution. Cells range from about 1 m in lidar-surveyed areas to 30 m in global satellite data. Switchbacks narrower than a cell get averaged into the hillside.
- Side slopes. A route drawn or recorded a few meters off the real tread is sampled higher or lower on the hill. On a steep traverse that error wobbles from point to point.
- What the survey saw. Radar tends to read the top of the forest canopy rather than the ground. And a DEM knows nothing about bridges or tunnels, so a trail crossing a gully dips to the creek bed, and one through a tunnel climbs over the mountain.
A barometric altimeter, found in most trail-running watches, works differently. Air pressure falls steadily as you climb (about one hectopascal for every 8 m near sea level), so a pressure sensor tracks changes in height precisely, second by second, including the little rollers a DEM smooths away. The catch is that pressure also changes with the weather, and the watch can't tell a front moving in from a hill. Over a long day the reading drifts, often by tens of meters, and it needs a starting reference, which watches take from GPS, a DEM or an altitude you enter. A barometer is excellent at "how far did I just climb?" and mediocre at "how high am I?" (Watches without one fall back on GPS altitude, which is far noisier.)
Why the totals disagree
Total gain adds up every uphill step and ignores every downhill one. Measurement noise goes both ways, so it can only add: a profile that jitters by a meter every few points gains hundreds of phantom meters over a hundred miles, and the more points a file has, the more jitter gets counted. Watches suppress this by ignoring rises below a small threshold, and every manufacturer picks a different one. Official race numbers are often somebody's watch or a route planner, measured once. Two honest numbers for the same course can easily differ by 10–15%.
How ultraPacer builds a profile
- Source. When you upload a GPX file or import a Strava route, ultraPacer keeps its elevation. If the file has none, we look up every point in Mapbox's global terrain model at its finest resolution. Reading a grid cell by cell leaves small stair steps, so that data gets a light smoothing pass whose window scales with the course: about ±60 m on a 50K, ±200 m on a 100-miler.
- Clean-up. When a course's file is loaded, duplicate points are dropped. No two neighboring points may differ by more than a 40% grade; any excess is spread onto the points either side, which knocks down single-point spikes. Then points that add no shape, like those along a straight, even stretch, are removed.
- Gain and loss are counted from the cleaned points. That is the total on the course page: smoothed if ultraPacer fetched the DEM, unsmoothed if your file brought its own elevation.
- Grade is what actually drives the pacing, and it is never the slope between two points. At every point ultraPacer fits a straight line through all the points within 50 m either side, weighting nearer ones more heavily, and takes that line's slope, capped at ±50%. A 100 m window is short enough to catch a steep pitch and long enough for meter-scale jitter to average out. The course page's elevation chart is drawn the same way.
- Altitude feeds the altitude factor: above 750 m, pace slows about 6% for every 1,000 m. Here absolute height matters, but only coarsely. Even 50 m of barometer drift moves that factor by a fraction of a percent.
- Overrides. A course owner who knows the true distance, gain or loss can enter it. ultraPacer then scales every uphill grade by the ratio of the override to the measured gain, and every downhill grade by the same ratio for loss.
One thing ultraPacer deliberately ignores is the elevation in a recorded activity. When you upload your race to compare it with the plan, grade and altitude are read from the course, so a drifting barometer can't distort the comparison.
Try it
Below is a made-up 20 km trail section with a big climb, a rolling ridge, a long descent and a bridge over a 46 m (150 ft) deep gully near the end, measured both ways. Switch the source and the smoothing and watch the numbers.
- With smoothing off, the elevation model counts about 14% more climbing than the trail has, and its steepest "climb" hits the 50% cap. Switch to Grade to see why: point-to-point grades are mostly noise.
- At ±50 m, most of the noise is gone. Most of the extra gain left is the climb out of the gully, which the trail never makes and no smoothing can remove. Push to ±200 m and the real rollers get flattened too, and both the gain and the steepest pitch come out low.
- The barometer counts almost the right gain but finishes more than 30 m high, because the air pressure fell as the weather changed over the four hours. Smoothing can't fix that, because it isn't noise.
- Open the close-up: the elevation model drops into the gully at the bridge while the barometer stays on the deck.
Each point read from a 10 m elevation grid. The route wanders a few meters off the tread, and on the steep traverses that lands points higher or lower on the hillside. At the bridge the model reads the gully floor.
When the elevation looks wrong
- Ask where the other number came from. A course's gain disagreeing with the race website by 10% is normal. Neither is necessarily wrong. Almost always, published gain should be assumed to be an approximation.
- Spiky profile, or a total well above the official one? The file's elevation is probably noisy, which is common with watch recordings. Course owners can use Update elevation data under Source data in the course editor to swap in the DEM.
- A sharp notch at a creek crossing, or a spike over a tunnel? That is the DEM seeing the ground. A short one costs a few seconds in a plan, so it is usually safe to ignore. If it matters, upload a file with barometric elevation instead. If your course has significant bridges, trestles or tunnels, get in touch: we are working on tools to flatten those sections of the DEM.
- Distance and gain both short? The route is probably cutting switchbacks. Redraw it snapped to the trail, or use a recording of the actual course.
- Don't chase the total. Pacing runs on the smoothed grade, so jitter that inflates the headline gain barely changes the plan.
- Override last. An override scales every climb by the same ratio. If the extra gain is noise on one flat stretch, forcing the total down makes every real climb look easier than it is. Fix the source first, then override only a number you trust.
- On race day, calibrate your watch to the start line's altitude and don't expect its total to match anyone else's. If the weather turns, its altitude will drift with the pressure, so recalibrate at an aid station whose altitude you know.
More on course setup, including overrides and loops, is in the course docs, and the grade and altitude models are described in the pacing models.
Happy trails!
-Danny (contact me)
What's new?
Resize the course page!
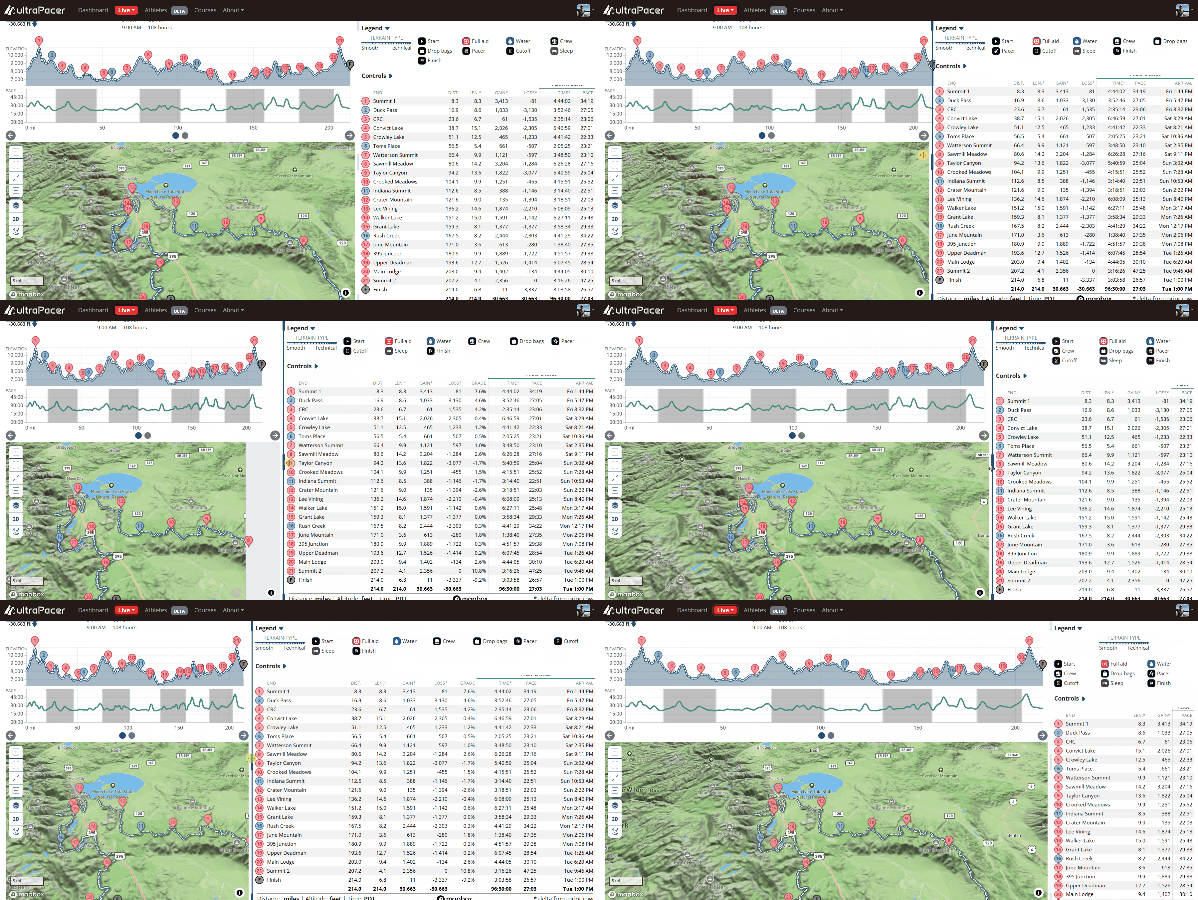
On wider screens there is now a divider between the chart and map and the tables beside them. Drag it to give the map more room or spread out the splits, nudge it with the arrow keys, or double-click to snap back to the default layout.