Western States 100 — 2026
Our live forecast, in review
Throughout the 2026 Western States Endurance Run, we ran a live finish-time forecast on ultraPacer for the whole field — updating it continuously as the race unfolded. At the front of the field our model matched the race remarkably well: the men's winner was predicted to within a few minutes of his actual finish for the entire final 20 miles.
Every prediction was driven by real-time check-in splits from ultralive.net fed into the ultraPacer modeling engine, which factors in course difficulty, terrain, altitude, heat, darkness, aid delays, and accumulating fatigue. Each time a runner hit a timing point, the model re-paced the rest of their day and produced a fresh finish estimate. The charts below replay those live forecasts as a function of course progress — exactly what you'd have watched evolve in real time. A solid line is the live forecast, a dashed line is the runner's actual final time, and a marker shows where a runner dropped. Vertical lines mark the aid stations.
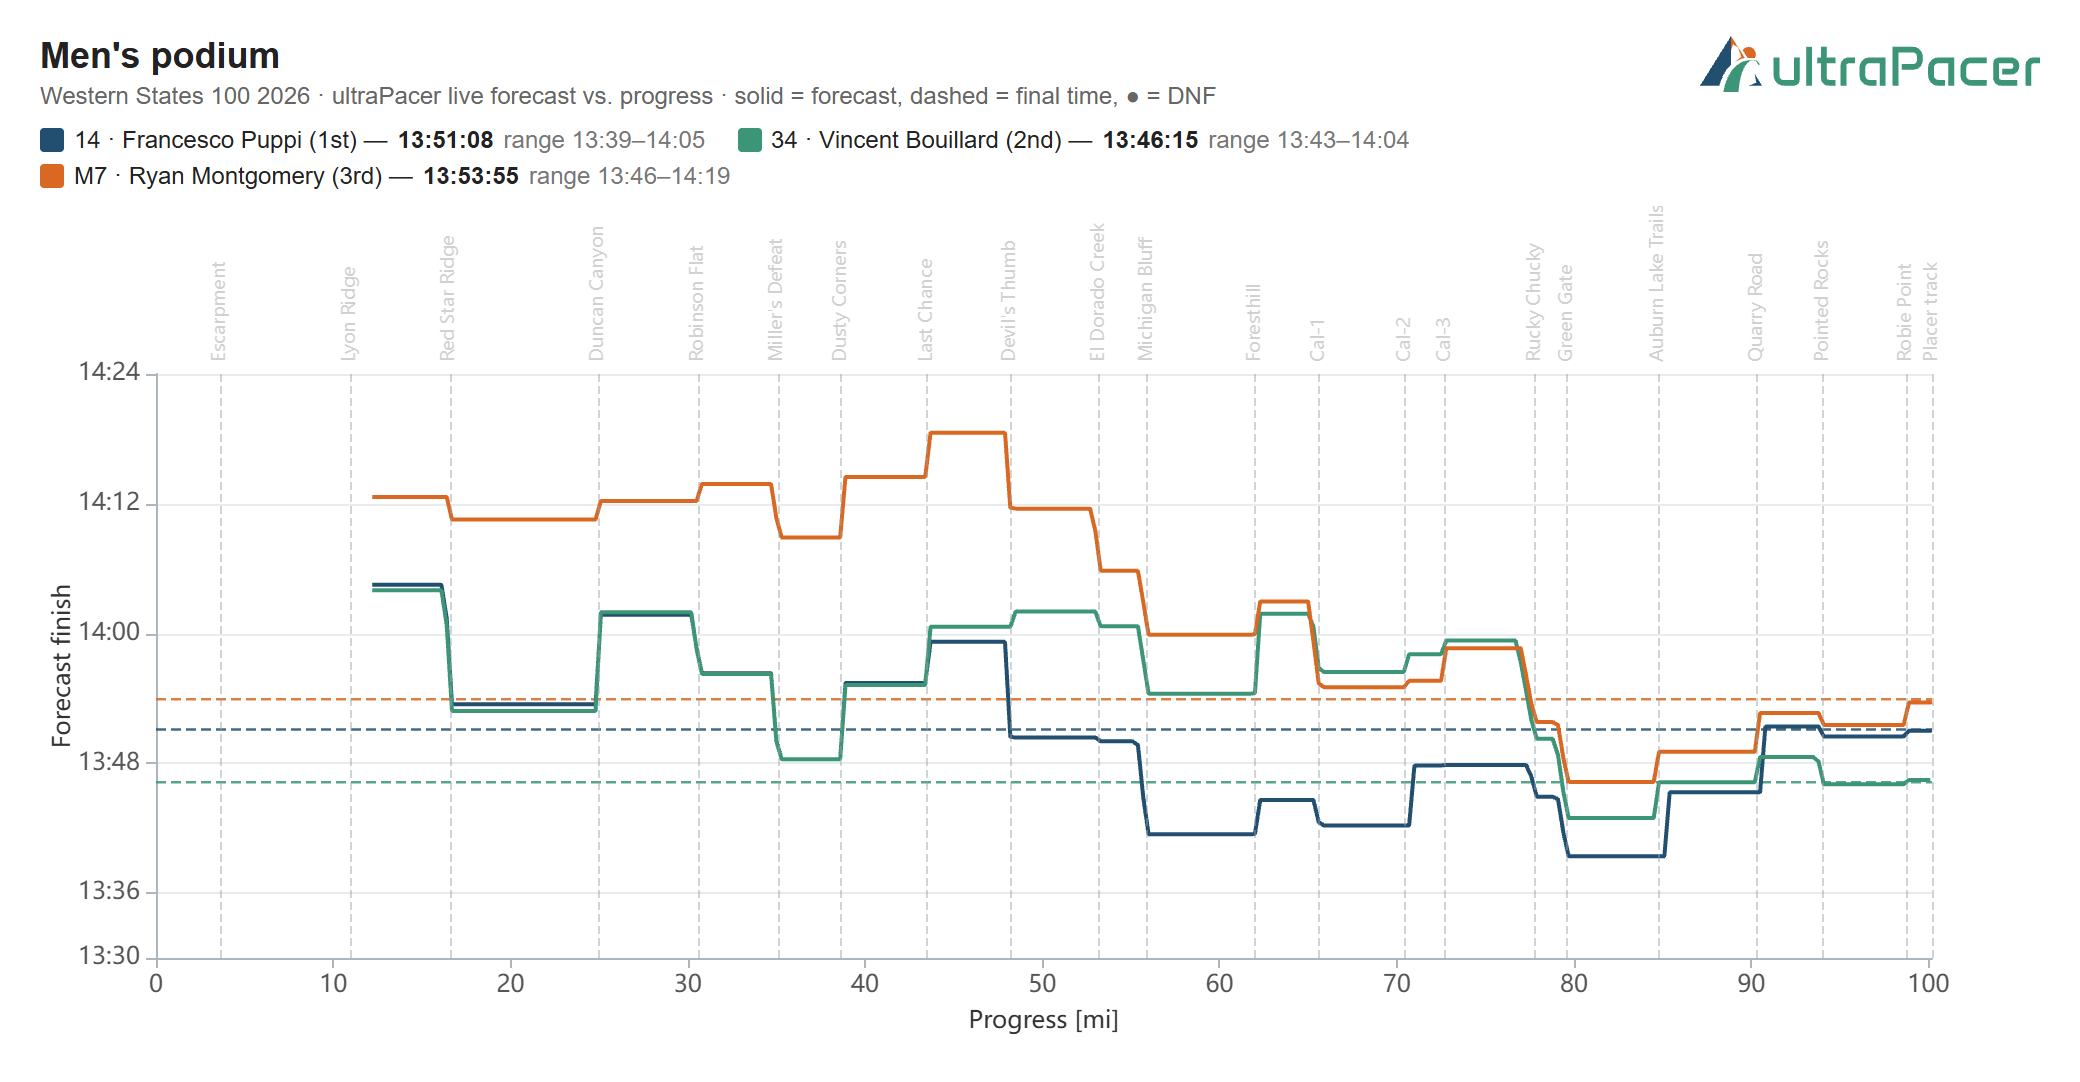
The men's podium
Vincent Bouillard, Francesco Puppi, and Ryan Montgomery filled out the men's podium. Their forecasts tell the story of a fast, controlled race: early predictions hovered around 14 hours, drifted up through the brutal canyons between Robinson Flat and Foresthill, then settled as each runner banked confirmed splits — converging within minutes of their actual finishes (13:46, 13:51, and 13:54) over the closing stretch. Our model was especially locked-in on Bouillard: from mile 80 to the line it held his forecast within about three minutes of his 13:46 winning time.
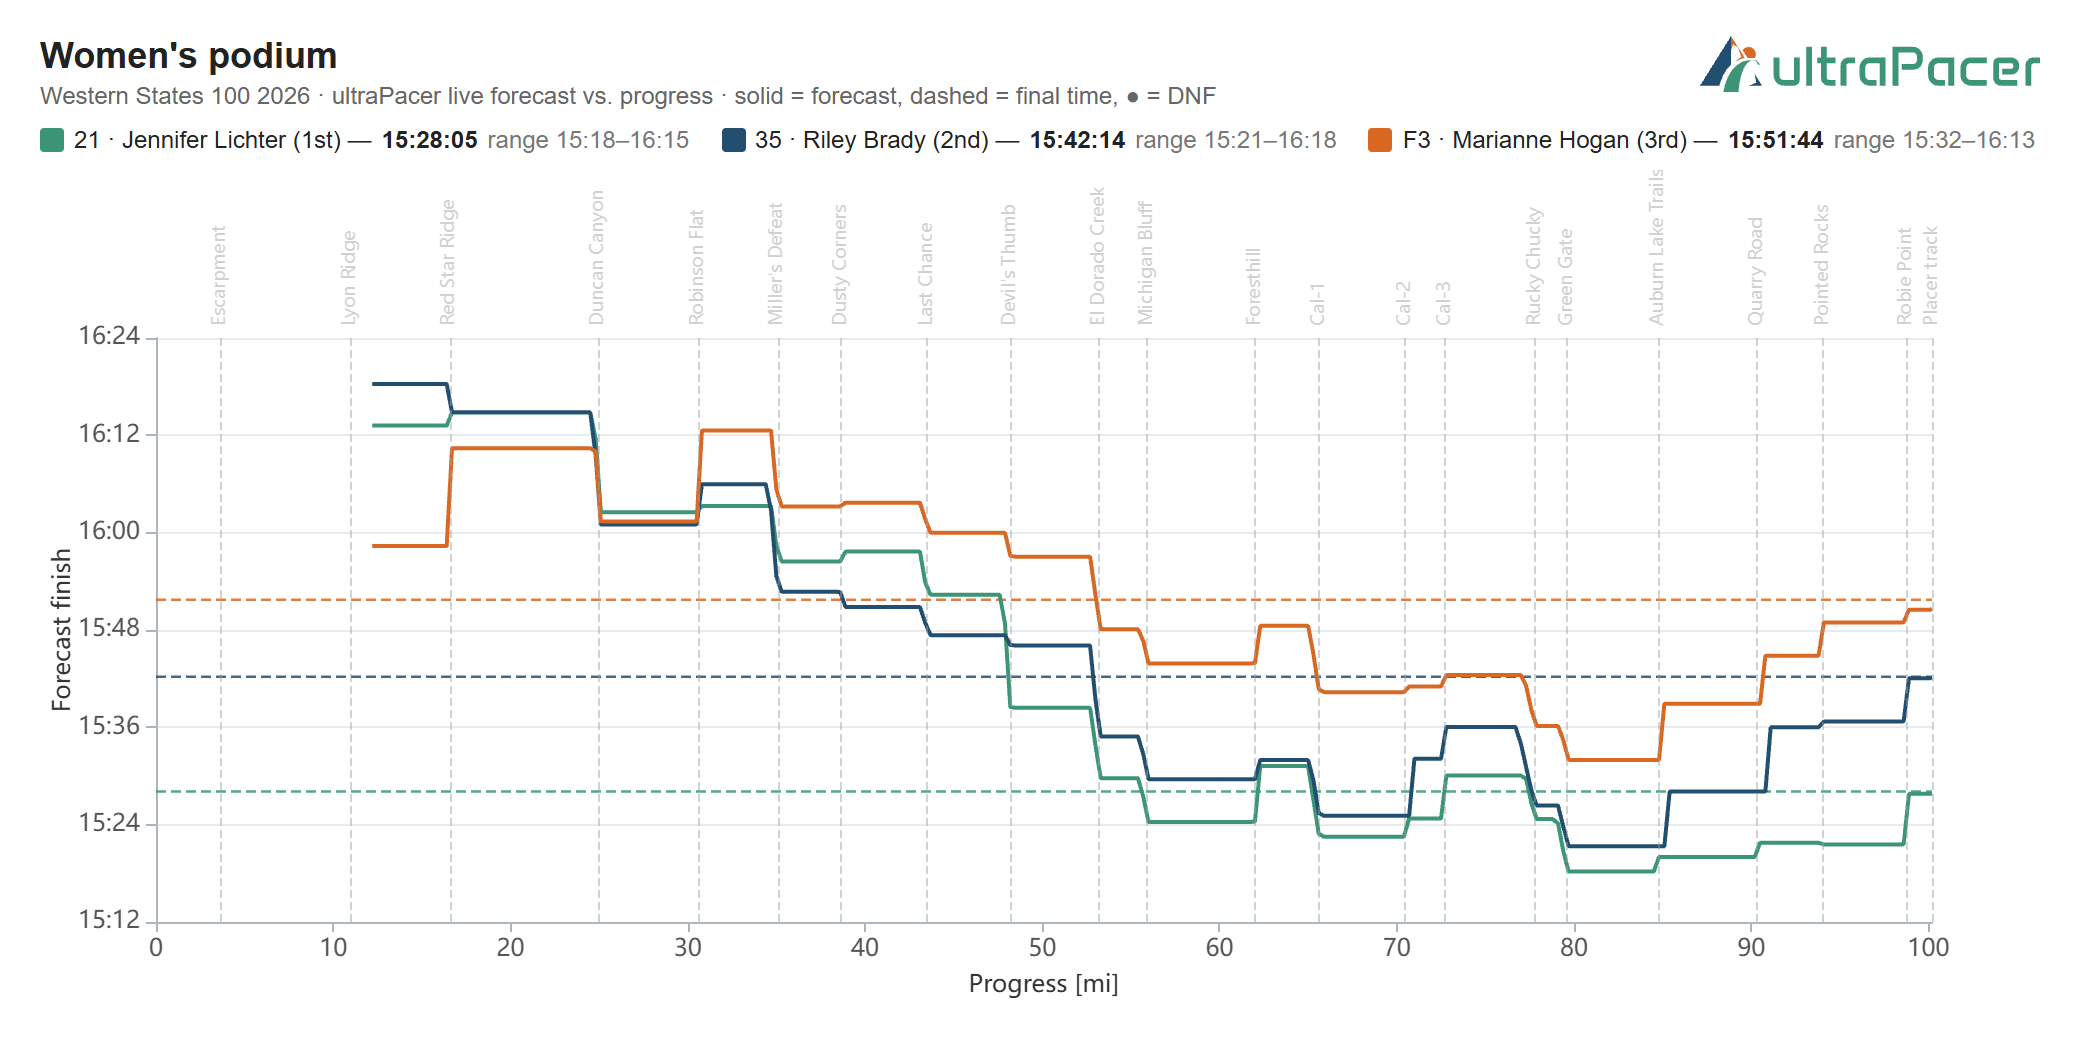
The women's podium
On the women's side, Jennifer Lichter, Riley Brady, and Marianne Hogan took the top three. Their live forecasts followed the same arc a few hours later in elapsed time — a steady tightening through the back half as the model gained confidence, homing in on finishes of 15:28, 15:42, and 15:52.
How to read these charts
If the modeling were perfect (or rather if everybody ran exactly how I modeled they would), we'd see perfectly flat straight lines in these plots. Trends downward indicate that the runner followed a more even split strategy than was assumed (20% degradation); trends upwards indicate more fatigue aggregation than assumed. Larger variability up and down generally indicates either uneven pacing by the runner, runner uphill/downhill effort preference, and/or inadequacies in the modeling.
What I learned (and what's next)
First off, I'm really happy with the results — the live model held up well against a deep field on a record-breaking race day. But we can always make things better, and lining the forecasts up against how the race actually played out surfaces a few things worth digging into, and they point at exactly where we can sharpen the model.
- Our model matched the front of the race really strongly. For the top ten finishers the live forecast tracked within a few minutes of their eventual time for most of the day. If anything it ran them slightly slow (~2–3 min through the middle miles), a hint that the flat late-race fatigue factor I applied — 20% — is a touch high for elite legs.
- It got steadily too optimistic toward the back of the field. Across the field the mid-race forecast drifted faster than the actual finish, and the gap grew with finishing position: roughly 45 minutes for the top third of finishers, but on the order of two hours for the back third. A single fatigue number can't fit that spread — front-runners fade a little, back-of-pack runners fade a lot. That same 20% is about right (maybe a hair high) at the sharp end and far too low deeper in the field.
- Heat and fatigue are tangled together and hard to separate for the elite runners. My observations of pacing in general suggests that the elite field is less affected by heat relative to their overall performance than the back-of-pack runners. However, for a race like this where the elite field comes in just after peak heat, we don't have much of a chance to see much speed-up after the sun goes down separate from overall fatigue.
What's next: I'm running a new calibration across the full ~330-finisher dataset to fit two things separately — a position-based fatigue factor (scaling with where a runner sits in the field, rather than one flat 20% for everyone) and a position-independent nominal heat factor. With that many finishers the fit should be strong, and future events will feed those position-aware values into certain plan inputs so the forecast is as sharp at the back of the pack as it is at the front. It's also important to note that statistically this race does not represent most events; there is a strong elite field, visibly separate from the main pack of runners, instead of a more continuous distribution throughout.
Build your own
Followed someone in the field? Pick up to six runners below to overlay their live forecasts. Scroll (or search by name or bib) through the full field and check the box next to anyone you want to plot — your picks appear as chips at the top, where you can click any one to remove it and free up a slot. The chart redraws as you go, with each runner's actual finish (or the point where they dropped) marked just like the podium charts above. Hit Share to copy a link that reopens this page with your exact selection.
Loading the field…
Everything here is a faithful replay of my live model output from the 2026 event, reconstructed from the same ultralive.net check-in data that drove the live site. Want this for your race? ultraPacer offers free live, model-backed spectator forecasting for events timed by ultraLive and OpenSplitTime.
Happy trails!
-Danny (contact me)
What's new?
Western States 100 2026: our live forecast, in review
We ran a live, model-backed finish-time forecast for the entire Western States 100 field — and at the front of the race it matched remarkably well. See how the forecasts tracked each podium, then overlay your own runners. Read the review