Active Runner Mode
From plan to forecast: how Active Runner Mode works
A pacing plan is a prediction made in the calm before the race. Active Runner Mode is what happens to that plan once the gun goes off: every time your runner is seen at a checkpoint, ultraPacer re-paces the rest of the course from how they have actually been moving, and every arrival time your crew is watching shifts to match.
This article walks through what Active Runner Mode does for a crew and for the runner, then opens the hood on how a handful of check-ins become a finish forecast. At the end there is a simulator that runs the real pacing engine in your browser, so you can step through a race one check-in at a time and watch the forecast move.
Race day, automatically
You don't switch Active Runner Mode on. Twelve hours before a plan's start time the course page becomes Active, and it stays that way until a few hours after the last cutoff. In that window the Mode control at the top of the page offers Active Runner Mode (the menu item reads Active runner mode, or Live runner mode on a tracked race) alongside the usual planning view, and it's the mode your crew will live in. (You can also pick it early to preview what race day will look like.)
Where the check-ins come from depends on the race:
- Manual check-ins. Any plan on ultraPacer can do this, no timing company required. Crew taps Confirm start at the start, then Check in at each aid station as the runner comes through, entering the arrival and, if they like, the departure time.
- Automatic check-ins. If the race is timed by ultralive.net or OpenSplitTime and the course owner has connected it, the course is Live as well as Active. ultraPacer polls the timing feed every minute for every runner in the race, and the page picks up new splits within a minute or so of the timing mat. Crew links a bib to the plan once (Link Athlete) and never types a time all day. Anyone can also follow a runner by bib alone, with no plan and no account.
Either way, the plan table, the map and the elevation profile stop showing a static plan and start showing a live model of the runner's day.
What the crew sees
The most useful thing in Active Runner Mode is the least dramatic: the plan table still lists every aid station with an arrival time, but those times are now a forecast that is re-computed after every check-in. Confirmed arrivals get an In badge (and Out if a departure was recorded); everything downstream is shown as the projection it is. Time-of-day arrivals are anchored to the runner's actual start, not the scheduled one, so a late wave start doesn't throw the whole table off.
On the map and the elevation profile a red dot moves along the course at the modeled pace, so between checkpoints the crew still has a best estimate of where the runner is right now. Flip on the Plan scenario switch and a second, green dot shows where the plan said they would be, which is the quickest possible read on whether the day is going to script. The pace chart draws the live pace over the planned one in red: solid up to the last confirmed checkpoint, dashed beyond it.
For crews the payoff is logistics. Aid stations in the mountains are often an hour's drive apart, and the question is never "how is the runner doing?" so much as "when do we need to leave?" A forecast that absorbs the last three splits answers that far better than a plan written a week ago. It also gives pacers a realistic pickup time, tells the crew whether there's time to sleep, and flags trouble early: waypoint cutoffs are highlighted in the table whenever the forecast arrival would miss them.
For runners the value is mostly in the debrief and in trust. Crews who can see a credible forecast make calmer decisions, and a runner who knows the crew will be there doesn't burn energy worrying about it. Afterward, the Details tab can put the live model and the plan side by side, and the same check-ins become the record of how the day really went.
How a check-in becomes a forecast
To understand the live model it helps to remember what a plan is. ultraPacer never schedules a race as "twelve minutes per mile." It solves for a single normalized pace: the flat, sea-level, daylight pace that, once every point on the course is multiplied by its grade, altitude, terrain, heat, darkness and fatigue factors, and the planned aid-station stops are added, lands on your target finish. The plan table is just that one pace pushed through the course's factors.
A check-in is a fact the model has to honor. Active Runner Mode feeds each confirmed arrival to the engine as a fixed time at that checkpoint. The first check-in splits the course in two: the section the runner has completed, and everything still ahead. Each further check-in splits the completed part again. For every completed section the engine now does the plan calculation in reverse: given the time it actually took, and the hills, altitude, heat and darkness it actually contained along with the fade the plan already expected there, what normalized pace was the runner producing?
That reverse solve is the important idea. A slow split up the big climb is not a fade if the climb explains it, and a quick split on a downhill is not a surge. Normalizing each section strips the course out of the numbers so what's left is the runner.
The remaining course is then paced forward from those observed paces. Active Runner Mode weights the completed sections by distance, and ramps that weight so the later part of what a runner has covered counts for more than the early miles. A runner who went out fast and is now slowing is projected from something closer to their current pace than their average. In short:
observed NP  =  Σ(NPi · disti · wi)  /  Σ(disti · wi)      over completed sections
remaining    =  Σ(observed NP · factorj · distj)  +  remaining aid-station dwell
forecast     =  last check-in time  +  remaining
The remaining factors carry everything the plan already knew about the rest of the course, including the parts a runner can't see from the trail: the heat that peaks mid-afternoon, the darkness that arrives on the last ridge, and the plan's fatigue curve. That last one matters. The observed pace is a measure of what the runner has done; the fatigue curve is the expectation that they will keep slowing from here, exactly as the plan assumed. The two combine, so a runner right on plan at halfway is forecast to finish on plan, not at an impossible even split.
Two more adjustments keep the forecast honest:
- Aid-station time. Where a check-in has both an arrival and a departure, the observed stop replaces the plan's guess for that station. Where the feed only has one of the two, the other is back-computed from the dwell the model applies there, so the modeled departure lands on the known time. Stops still ahead use the plan's own stop for that station, or its typical dwell where it sets none.
- Field position. A flat plan assumes everyone fades and lingers at aid stations like the plan's author. In the Western States review we found that this forecasts the back of the pack too fast, by a lot. For races with live tracking the forecast now scales the remaining fatigue and dwell by where the runner sits in the field: about ×1 for the leaders, rising to ×2 at the very back. That calibration, fit against the full 2026 Western States field, roughly halved the back-of-pack forecast error. (One nuance: with a plan selected, Active Runner Mode keeps that plan's own fatigue curve and scales only the aid-station time; the leaderboard and bib-only tracking scale both.)
Finally, what the live model deliberately does not do: it never enforces cutoffs. A plan bends its pacing to make every cutoff; a forecast is a projection of what is really happening, and if that projection misses a cutoff you want to see it, not have it hidden. And by default, when a feed-tracked runner is overdue at a checkpoint, the forecast holds them back to the latest time anyone has been seen there rather than sailing them through on schedule, so an unconfirmed runner isn't shown further along than the data supports. (A race can instead set a checkpoint to hold runners until their own check-in arrives, or to let them through on pace.)
Try it
Below is a fictional 50-mile course with eight aid stations and a plan for a 12-hour finish. The demo follows a runner by bib, so that plan is the race's template rather than their own, and field position scales both its fatigue curve and its stops, as on the leaderboard. Pick how the runner's day goes, then use the slider (or Next check-in) to feed the checkpoints to the model one at a time. The green line is the plan; the red line is the live model, solid where it is confirmed and dashed where it is forecast; the dots are check-ins. Hover the chart to compare the two at any mile.
A few things to look for:
- In Faded late, the runner banks a few minutes through the first four checkpoints and the forecast sits a little under plan. Then the collapse starts, and each split pushes the finish later, by more than an hour over the back half. Nothing in the early splits predicts a blow-up, so the model can only follow it as it happens.
- In Started fast, the very first split projects a finish nearly an hour and a half under plan: the model takes the observed pace at face value and runs it through the rest of the course. Each slower split then walks the forecast back toward the plan and, by the end, past it.
- In Ran to plan, the forecast barely moves. Every split says the same thing the plan did, so the finish holds; this is what a well-modeled runner looks like. Finished strong is the mirror of the fast start: on plan early, then a forecast that drops with every negative split.
- Switch Field position from Front to Back and watch the dashed line bend: the observed pace hasn't changed, but the remaining fatigue and aid-station time are doubled, so the same runner at the front and at the back get different finishes.
On plan through halfway, then the wheels come off: the back half is far slower and every aid stop gets longer.
The runner has started. No checkpoint has reported yet.
Getting your crew set up
- Share a link to your plan with your crew before the race.
- Crew sign in and save the plan to their feed so it's a tap away on race morning. (Any crew member can follow along without an account; entering manual check-ins needs one.)
- On race day, open the plan and choose Active Runner Mode from the Mode control. For a timed race, use Link Athlete to connect your bib; otherwise tap Confirm start as the race begins.
- For timed races the rest is automatic. Otherwise, check the runner in as they arrive at each aid station; recording the departure too makes the next forecast a little sharper.
The full race-day guide, including the spectator Race Overview for tracked races, is in the Live & Race-Day docs.
Live, model-backed forecasting is free for events timed by ultraLive and OpenSplitTime, and manual Active Runner Mode works on every plan. If you organize a race and would like it connected, get in touch.
Happy trails!
-Danny (contact me)
What's new?
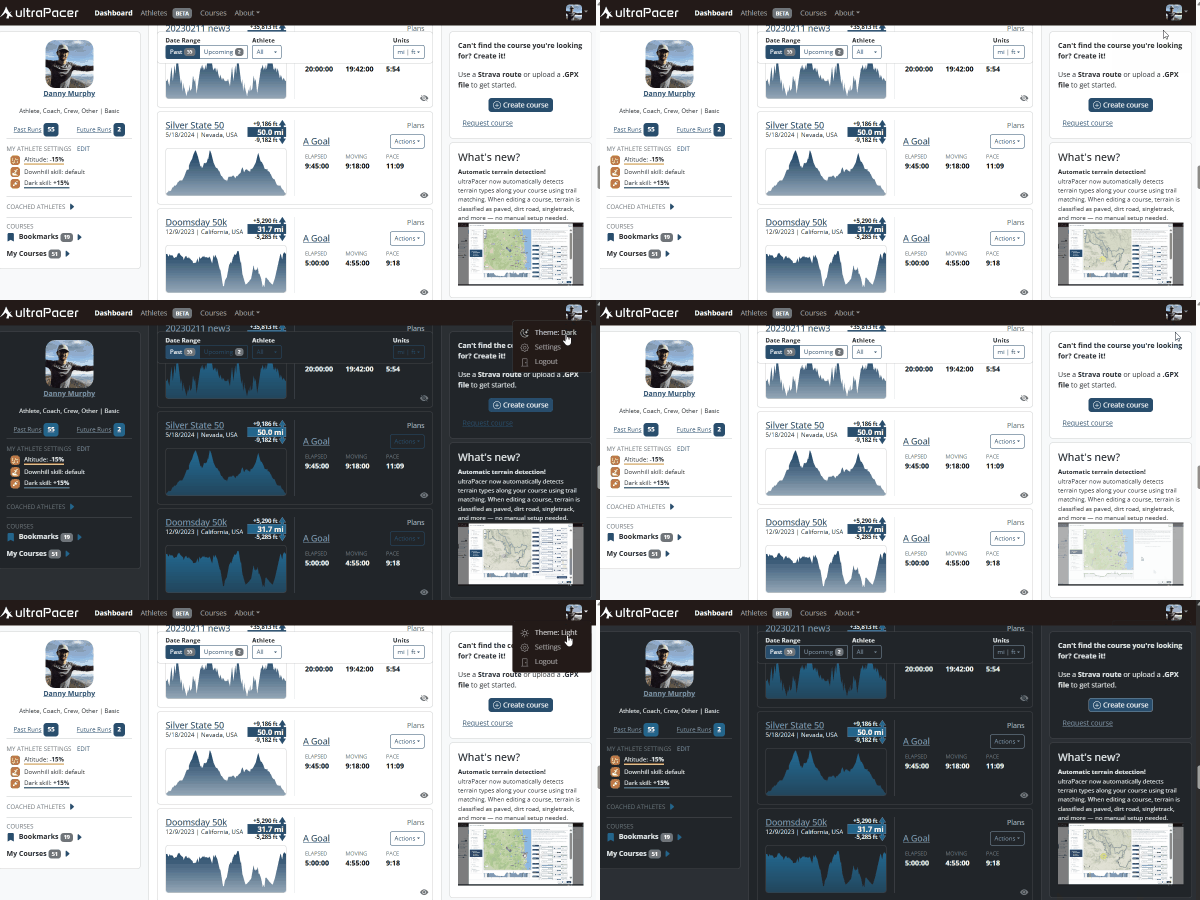
Dark mode is here!
ultraPacer now has a dark theme that’s easier on the eyes in low light. Tap the theme option in the menu to switch between light, dark, or auto — which follows your system setting.